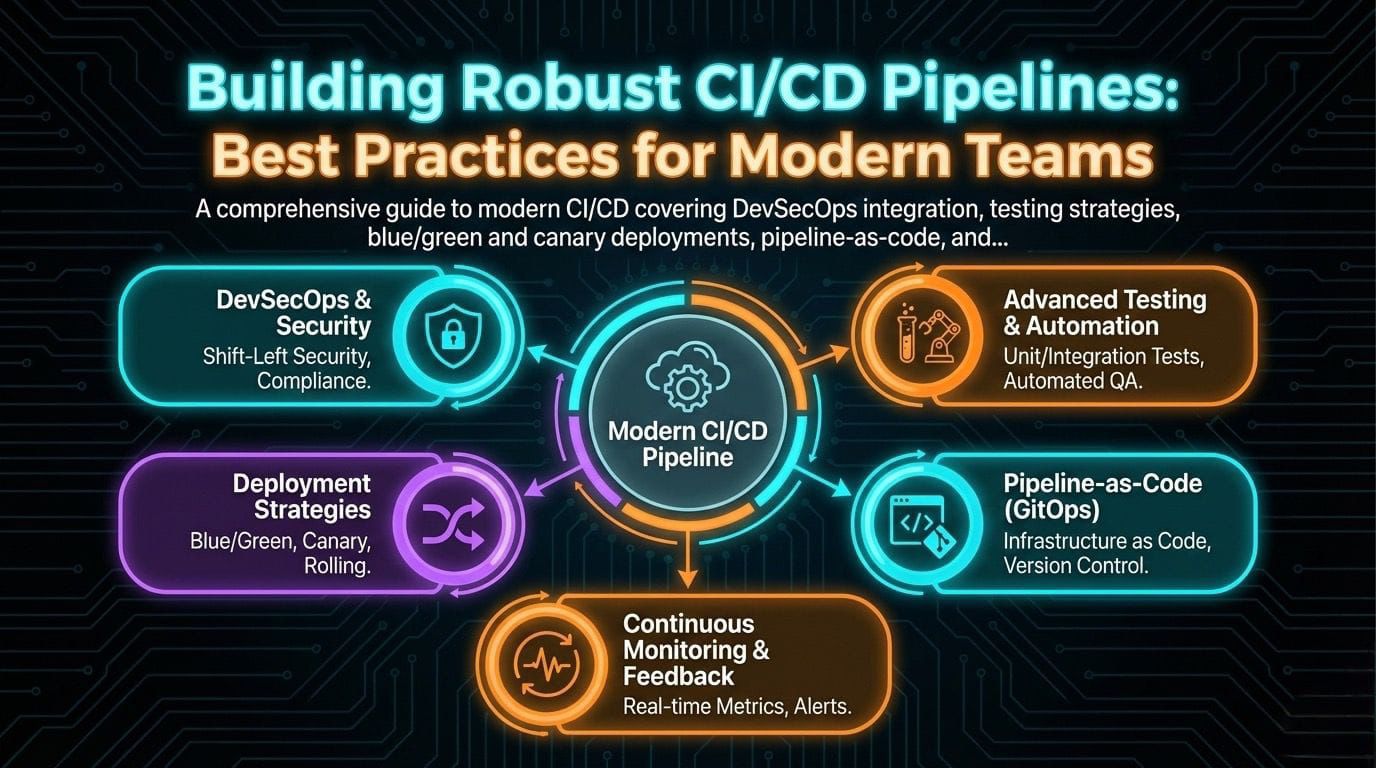
CI/CD pipelines are the backbone of modern software delivery. But there's a vast difference between a pipeline that "works" and one that enables your team to deploy confidently, multiple times per day, with minimal human intervention. This guide goes beyond the basics to cover the practices that separate high-performing engineering organizations from the rest.
The Anatomy of a Modern Pipeline: Beyond Build-and-Deploy
A mature CI/CD pipeline is far more than "compile code, run tests, deploy." It's a comprehensive quality gate that validates every aspect of your software before it reaches users. Let's examine what a production-grade pipeline looks like in 2025.
█Œ─────────────────────────────────────────────────────────────────────┐
│                        CONTINUOUS INTEGRATION                        │
├─────────────█¬─────────────█¬─────────────█¬─────────────█¬─────────────┤
│   Commit    │    Build    │    Test     │  Security   │   Quality   │
│   Trigger   │   Compile   │   Suite     │    Scan     │    Gate     │
│             │   Package   │             │             │             │
│  • Webhook  │  • Compile  │  • Unit     │  • SAST     │  • Coverage │
│  • PR Open  │  • Deps     │  • Integ    │  • DAST     │  • Lint     │
│  • Schedule │  • Docker   │  • Contract │  • SCA      │  • Sonar    │
└─────────────█´─────────────█´─────────────█´─────────────█´─────────────█˜
                                    │
                                    ۬
█Œ─────────────────────────────────────────────────────────────────────┐
│                       CONTINUOUS DELIVERY                            │
├─────────────█¬─────────────█¬─────────────█¬─────────────█¬─────────────┤
│   Staging   │    E2E      │  Approval   │ Production  │  Monitor    │
│   Deploy    │   Tests     │   Gate      │   Deploy    │  & Alert    │
│             │             │             │             │             │
│  • Infra    │  • Smoke    │  • Manual   │  • Canary   │  • Metrics  │
│  • Config   │  • Perf     │  • Auto     │  • Blue/Grn │  • Logs     │
│  • Secrets  │  • Chaos    │  • Policy   │  • Rolling  │  • Traces   │
└─────────────█´─────────────█´─────────────█´─────────────█´─────────────█˜
DevSecOps: Security as a First-Class Citizen
Security can no longer be an afterthought or a separate team's responsibility. Modern pipelines integrate security checks at every stage—this is DevSecOps.
When: During build, before tests
What: Analyzes source code for vulnerabilities without executing it
Tools: SonarQube, Checkmarx, Semgrep, CodeQL
When: After dependency resolution
What: Scans dependencies for known vulnerabilities (CVEs)
Tools: Snyk, Dependabot, OWASP Dependency-Check
When: Against running application in staging
What: Tests running application for vulnerabilities
Tools: OWASP ZAP, Burp Suite, Nuclei
security-scan:
  runs-on: ubuntu-latest
  steps:
    - uses: actions/checkout@v4

    # SAST - Static Application Security Testing
    - name: Run Semgrep
      uses: returntocorp/semgrep-action@v1
      with:
        config: p/owasp-top-ten

    # SCA - Software Composition Analysis
    - name: Run Snyk
      uses: snyk/actions/node@master
      env:
        SNYK_TOKEN: ${{ secrets.SNYK_TOKEN }}
      with:
        args: --severity-threshold=high

    # Container Scanning
    - name: Run Trivy
      uses: aquasecurity/trivy-action@master
      with:
        image-ref: '${{ env.IMAGE_NAME }}:${{ github.sha }}'
        severity: 'CRITICAL,HIGH'
        exit-code: '1'

    # Secret Detection
    - name: Detect Secrets
      uses: trufflesecurity/trufflehog@main
      with:
        path: ./
        base: ${{ github.event.repository.default_branch }}
Deep Dive into Testing Stages: The Testing Pyramid
Not all tests are equal, and understanding where each type fits in your pipeline is crucial for fast feedback and comprehensive coverage.
The Testing Pyramid in CI/CD
                    █²
                   /│\
                  / │ \     E2E Tests (Few, Slow, Expensive)
                 /  │  \    - Full user journeys
                /   │   \   - Run in staging only
               /────█¼────\  - 5-10 critical paths
              /     │     \
             /      │      \   Integration Tests (Some, Medium)
            /       │       \  - API contracts
           /        │        \ - Database interactions
          /─────────█¼─────────\- Service boundaries
         /          │          \
        /           │           \  Unit Tests (Many, Fast, Cheap)
       /            │            \ - Business logic
      /             │             \- Pure functions
     /──────────────█¼──────────────\- Run on every commit
    █”█”█”█”█”█”█”█”█”█”█”█”█”█”█”█”█”█”█”█”█”█”█”█”█”█”█”█”█”█”█”█”█”
Shift-Left Testing: Catch Issues Early
"Shift-left" means moving testing earlier in the development lifecycle. The cost of fixing a bug increases exponentially the later it's discovered:
| Stage Discovered | Relative Cost to Fix | Time to Fix |
|---|---|---|
| During coding (IDE) | 1x | Minutes |
| Unit tests (CI) | 5x | Hours |
| Integration tests | 15x | Days |
| Staging/QA | 50x | Days-Weeks |
| Production | 100x+ | Weeks-Months |
Shift-Left Best Practices
Run linters and formatters in pre-commit hooks. Execute unit tests locally before pushing. Use IDE plugins for real-time static analysis. The goal: developers should know about issues before they even commit code.
Advanced Deployment Strategies
Deploying to production is where theory meets reality. Advanced deployment strategies minimize risk and enable rapid rollback when things go wrong.
Blue/Green Deployments
Blue/Green maintains two identical production environments. At any time, one (Blue) serves live traffic while the other (Green) is idle or receiving the new deployment.
Before Deployment:
█Œ─────────────────┐     █Œ─────────────────┐
│   Load Balancer │────█¶│   Blue (v1.0)   │ █€── Live Traffic
└─────────────────█˜     │   ACTIVE        │
                        └─────────────────█˜
                        █Œ─────────────────┐
                        │   Green (v1.0)  │ █€── Idle
                        │   STANDBY       │
                        └─────────────────█˜

During Deployment:
█Œ─────────────────┐     █Œ─────────────────┐
│   Load Balancer │────█¶│   Blue (v1.0)   │ █€── Live Traffic
└─────────────────█˜     │   ACTIVE        │
                        └─────────────────█˜
                        █Œ─────────────────┐
                        │   Green (v2.0)  │ █€── Deploying + Testing
                        │   DEPLOYING     │
                        └─────────────────█˜

After Switch:
█Œ─────────────────┐     █Œ─────────────────┐
│   Load Balancer │     │   Blue (v1.0)   │ █€── Standby (rollback ready)
└────────█¬────────█˜     │   STANDBY       │
         │              └─────────────────█˜
         │              █Œ─────────────────┐
         └─────────────█¶│   Green (v2.0)  │ █€── Live Traffic
                        │   ACTIVE        │
                        └─────────────────█˜
Prerequisites:
- Load balancer capable of instant traffic switching
- Database migrations must be backward-compatible
- Sufficient infrastructure for two full environments
- Automated smoke tests to validate before switching
Canary Releases
Canary releases gradually shift traffic to the new version, monitoring for issues before full rollout. This is ideal for high-traffic applications where even brief outages are costly.
Phase 1: 1% Traffic (Canary)
█Œ─────────────────┐
│   Load Balancer │
└────────█¬────────█˜
         │
    █Œ────█´────┐
    │         │
    ۬         ۬
█Œ───────┐ █Œ───────┐
│ v1.0  │ │ v2.0  │
│  99%  │ │   1%  │ █€── Monitor error rates, latency
└───────█˜ └───────█˜

Phase 2: 10% Traffic
█Œ───────┐ █Œ───────┐
│ v1.0  │ │ v2.0  │
│  90%  │ │  10%  │ █€── Compare metrics to baseline
└───────█˜ └───────█˜

Phase 3: 50% Traffic
█Œ───────┐ █Œ───────┐
│ v1.0  │ │ v2.0  │
│  50%  │ │  50%  │ █€── A/B comparison
└───────█˜ └───────█˜

Phase 4: 100% Traffic (Complete)
█Œ───────┐ █Œ───────┐
│ v1.0  │ │ v2.0  │
│   0%  │ │ 100%  │ █€── Full rollout
└───────█˜ └───────█˜
Prerequisites:
- Traffic splitting capability (service mesh, ingress controller)
- Real-time monitoring with automated rollback triggers
- Feature flags for fine-grained control
- Stateless application design (or sticky sessions)
Pipeline as Code: Version Control Your Infrastructure
Your pipeline definition should be treated as code: version-controlled, reviewed, tested, and auditable. This is non-negotiable for mature organizations.
name: Production Pipeline

on:
  push:
    branches: [main]
  pull_request:
    branches: [main]

env:
  REGISTRY: ghcr.io
  IMAGE_NAME: ${{ github.repository }}

jobs:
  # Stage 1: Build and Unit Tests
  build:
    runs-on: ubuntu-latest
    outputs:
      image-tag: ${{ steps.meta.outputs.tags }}
    steps:
      - uses: actions/checkout@v4

      - name: Setup Node.js
        uses: actions/setup-node@v4
        with:
          node-version: '20'
          cache: 'npm'

      - name: Install Dependencies
        run: npm ci

      - name: Run Linting
        run: npm run lint

      - name: Run Unit Tests
        run: npm run test:unit -- --coverage

      - name: Upload Coverage
        uses: codecov/codecov-action@v3

      - name: Build Docker Image
        uses: docker/build-push-action@v5
        with:
          context: .
          push: false
          tags: ${{ env.IMAGE_NAME }}:${{ github.sha }}

  # Stage 2: Security Scanning (parallel)
  security:
    needs: build
    runs-on: ubuntu-latest
    steps:
      - uses: actions/checkout@v4
      - name: Run Security Scans
        # ... security scanning steps

  # Stage 3: Integration Tests
  integration:
    needs: build
    runs-on: ubuntu-latest
    services:
      postgres:
        image: postgres:15
        env:
          POSTGRES_PASSWORD: test
    steps:
      - name: Run Integration Tests
        run: npm run test:integration

  # Stage 4: Deploy to Staging
  deploy-staging:
    needs: [security, integration]
    runs-on: ubuntu-latest
    environment: staging
    steps:
      - name: Deploy to Staging
        run: |
          # Deploy using kubectl, helm, or cloud CLI

  # Stage 5: E2E Tests
  e2e:
    needs: deploy-staging
    runs-on: ubuntu-latest
    steps:
      - name: Run E2E Tests
        run: npm run test:e2e

  # Stage 6: Deploy to Production (manual approval)
  deploy-production:
    needs: e2e
    runs-on: ubuntu-latest
    environment: production  # Requires approval
    steps:
      - name: Deploy Canary (10%)
        run: |
          # Deploy canary version
      - name: Monitor Canary
        run: |
          # Check error rates, latency
      - name: Promote to 100%
        run: |
          # Full rollout
The Feedback Loop: Monitoring Post-Deployment
CI/CD doesn't end at deployment. The feedback loop—monitoring production and feeding insights back to development—is what enables continuous improvement.
Key Metrics to Monitor
- Deployment Frequency: How often you deploy to production
- Lead Time: Time from commit to production
- Change Failure Rate: % of deployments causing incidents
- MTTR: Mean time to recover from failures
- Error Rate: 5xx errors, exceptions
- Latency: p50, p95, p99 response times
- Throughput: Requests per second
- Saturation: CPU, memory, connections
Automated Rollback Triggers
Configure your monitoring to automatically trigger rollbacks when thresholds are breached:
groups:
  - name: deployment-alerts
    rules:
      - alert: HighErrorRate
        expr: |
          sum(rate(http_requests_total{status=~"5.."}[5m]))
          / sum(rate(http_requests_total[5m])) > 0.05
        for: 2m
        labels:
          severity: critical
          action: rollback
        annotations:
          summary: "Error rate > 5% - triggering rollback"

      - alert: HighLatency
        expr: |
          histogram_quantile(0.95,
            sum(rate(http_request_duration_seconds_bucket[5m]))
            by (le)) > 2
        for: 5m
        labels:
          severity: critical
          action: rollback
        annotations:
          summary: "P95 latency > 2s - triggering rollback"
Conclusion: The Path to Elite Performance
Building robust CI/CD pipelines is a journey, not a destination. The practices outlined here represent the current state of the art, but the field continues to evolve. Key takeaways:
- Security is not optional: Integrate SAST, SCA, and DAST into every pipeline
- Test strategically: Follow the testing pyramid; shift left aggressively
- Deploy safely: Use blue/green or canary strategies; always have a rollback plan
- Treat pipelines as code: Version control, review, and test your pipeline definitions
- Close the feedback loop: Monitor production; let metrics drive improvements
Elite engineering organizations deploy hundreds of times per day with confidence. The difference isn't magic—it's disciplined application of these practices, continuous improvement, and a culture that values both speed and safety.